DBDOC 10.5.1 has made its appearance this summer, with some major updates to our support for SPlus and PGP graphics, as well as completely reworked 800xA support. Database tag records are now much clearer and complete than ever before. And with the addition of Error Data Sharing, the first example of data sharing support for Hyperview users is now complete.
Improved Database Tag Records
One of the first changes you might notice upon upgrading to DBDOC 10.5.1 (download here), is the completely reworked presentation of database tag records in the Hyperview browser.
For historical reasons, tag records displayed in Hyperview used to look like this:
Improved Database Tag Records
One of the first changes you might notice upon upgrading to DBDOC 10.5.1 (download here), is the completely reworked presentation of database tag records in the Hyperview browser.
For historical reasons, tag records displayed in Hyperview used to look like this:

And now they look like this, which is a lot easier to read:

Complete Tag Information from Operate IT and SPlus
In addition, ALL data is now extracted from Operate IT (PPB and 800xA) XML database files, and are now be usefully displayed (and searchable) within DBDOC. Previously only a limited subset of tag attributes was extracted by DBDOC and presented in the Hyperview browser.
Before:

After:

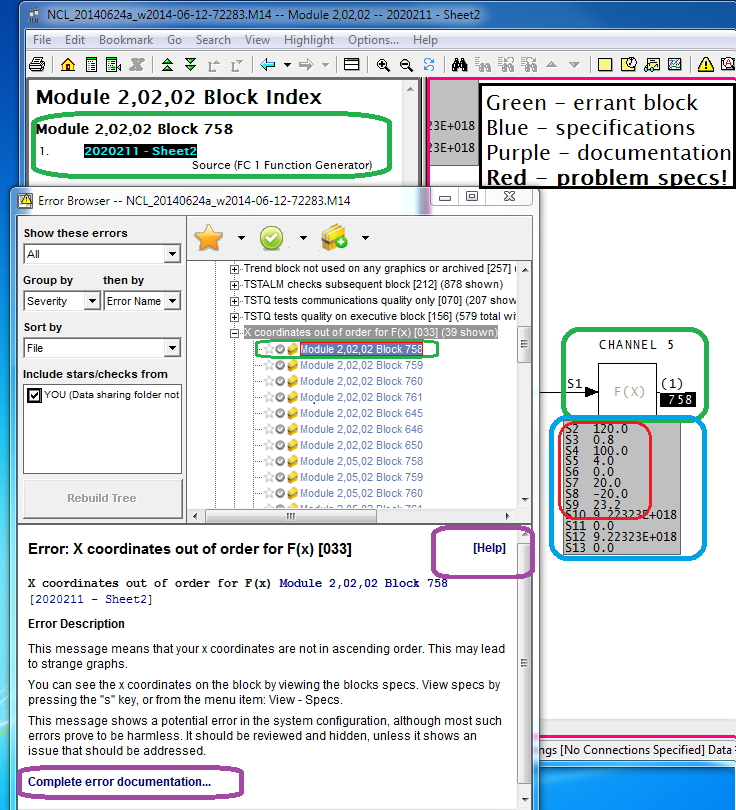
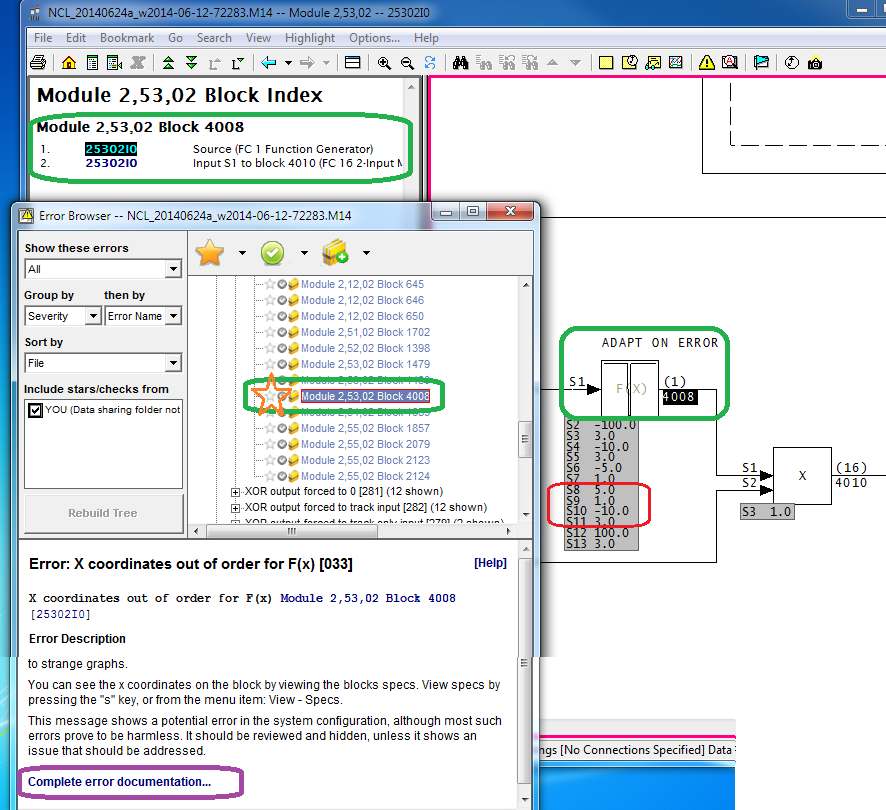
Error Sharing
Another change you might notice, if you were introduced to the Error Browser in the last release, is the appearance of a new checkbox list on the left hand side of the browser window. This is a list of users on your system who are sharing their error stars and checks, which you can choose to display in your Error Browser. This makes it easy to review errors collaboratively. It is planned for future releases to include shared bookmarks, annotations, Watch Window groups, and Watch Window data.
.png)
To participate in error data sharing, use the new Sharing tab of the Options dialog to register for sharing in a specified Shared Data Folder. Usually the name of the Shared Data Folder will be supplied in the project file, so all you have to do to start sharing is hit OK to register.

Extended Support for SPlus and PGP Graphics
If you have SPlus or PGP graphics, you will notice substantial developments in DBDOC's support for these formats. Support has been extended past the initial support of systems converted from Conductor VMS systems to include consoles converted from Conductor NT and Process Portal B. Live controller data has been added.
Extended and Reworked Support for 800xA Graphics
The support for 800xA has been completely reworked to make use of data extracted by programs from Assistance Système LD Inc. (ASSYST) giving better images, access to controller data and text searching on graphics, and eliminating the numbers and arrows seen in earlier versions using the previous approach to extracting these graphics for DBDOC.

Other Updates
In addition to the major developments described above, 10.5.1 delivers plenty of minor bug fixes and
improvements. More DBDOC error types have now been converted to display in the Error Browser. Live data (notably in the Watch Window) can now be requested every 100ms. Go To Use right-click navigation in Hyperview now places system uses before DBDOC generated documents. Timestamp labels can now be hidden in the Watch Window. CIUMon logging has been improved in many ways. Command line support for importing DBDOC projects has been implemented, making it much easier to migrate the DBDOC build system to a new computer. And many more small changes which you may or may not encounter but which increase DBDOC's robustness and usefulness in specific situations.
If you haven't already, take a moment to download DBDOC 10.5.1 and upgrade your system.

.png)
.png)


.png)


