
With DBDOC 11.2, Hyperview has added a number of interesting visual features on configuration diagrams that should make signal tracing even more intuitive.
You've probably noticed the first new feature. Now, when you mouse over a signal line on a CAD/CLD, it highlights and shows a tooltip with the block number and the quality type of the signal. This is handy for quickly decoding a visual rat's nest of signals.
 |
| Hovering the mouse over a signal line highlights it in yellow. |
If you want a better look, simply click on the signal line. The highlight will "stick".
 |
| The line is now sticky-highlighted in orange. |
Input Trees
You can visually display the "tree" of inputs for a block by right-clicking on a function block and choosing "Show Input Tree For This Block". All the signals leading into the block and their ancestors are highlighted in red.
 |
| From a function block's context menu, you can display the input tree for a block. |
If you trace the signal onto another sheet via the IREF, the input tree highlight continues on the adjacent CAD/CLD.

Of course, it depends on the particulars whether this sort of visual signal tracing is helpful. Many configuration diagrams contain feedback loops, causing virtually every block on the sheet to become highlighted.
If an IREF is connected to an OREF on the same sheet, both will be highlighted, of course.
Here, for example, the input tree for Block 4109 has been shown.

Zooming out, we can see that an OREF is highlighted, as well as a number of IREFs.

Luckily, it is quick and easy to see why. Hovering the OREF signal shows that it is in fact the identical signal that comes in the IREF in the lower left of the diagram.
 |
| The yellow highlight shows that both the OREF and IREF are connected to Block 4219. |
Output Trees
Output trees can be displayed in the same way, and are shown in green.

Both input and output trees can be shown at the same time, for different blocks, or the same block.

Note: It's worth knowing that the input or out signal tree is calculated "on the fly," when you load a document. Most of these trees would be very large indeed, if they were computed in totality for the entire system. This "on the fly" tree building should not affect you if you are physically tracing signals from sheet to adjacent sheet, but if you "skipped ahead" without going through connecting sheets, lines would not be highlighted, even if they were in fact ultimately in the ancestor or descendant tree of the root block.
Quality
The new line information also gives you more information about signal quality. Of course, you can already see if a line has quality, based on whether it is black or blue.
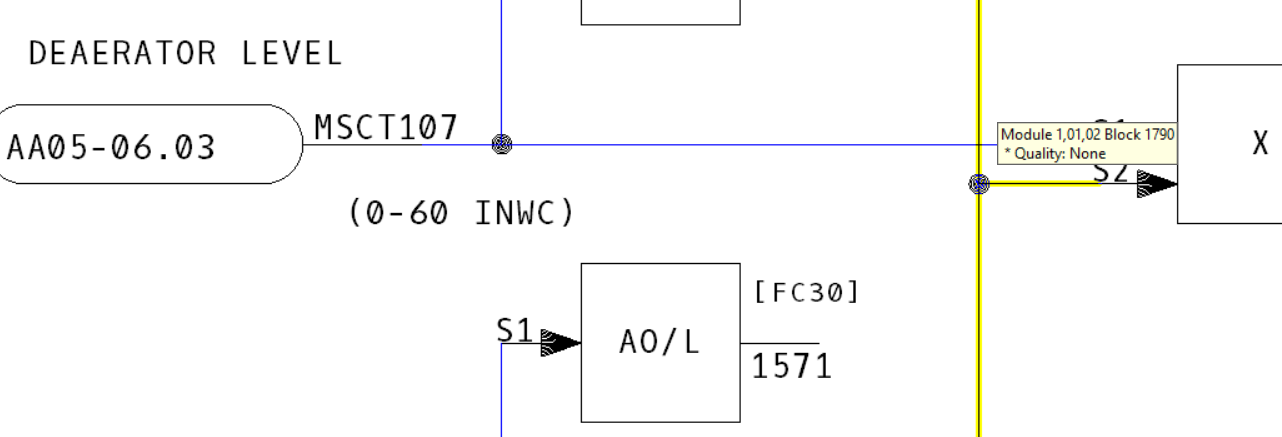 |
| Block 1790 is black, and has no quality. |
