DBDOC 11.2 Feature Update is an improvement on DBDOC 11.2 that addresses issues that came to light as 11.2 was used in the field over the past few months. If you are upgrading, DBDOC 11.2 Feature Update is now the preferred upgrade version, and is available here.
What does 11.2 Feature Update add to 11.2?
Most significantly, your feedback on DBDOC 11.2 has provided enough information to make a number of improvements to our support for SPlus graphics, such as the following:
Live Specs on Ladder
In another area, in response to client feedback, Hyperview has added full support for the "new" live specs on ladder diagrams (not just CAD/CLD diagrams). Prior to DBDOC 11.1, live specs were implemented as a form of live loop annotation, but this could be a highly inefficient use of live data bandwidth, as almost never changing specs were fetched as often as other sorts of live data. In DBDOC 11.1, specs were integrated with layered specs, and comparisons between live and static specs were automated (read more here). However, on our first pass, we missed adding this feature to ladder diagrams. This has now been corrected, and clients with ladder diagrams can now enjoy full-featured and bandwidth-efficient live specs.
Working CIUMON Interaction with ABB HAOPC
Several clients encountered a problem where CIUMON was found to be receiving data only once every 10 seconds from HAOPC. This has now was fixed and has been subsequently verified in three different client systems.
Documentation for Custom Function Codes

Improved S+ Support
Most significantly, your feedback on DBDOC 11.2 has provided enough information to make a number of improvements to our support for SPlus graphics, such as the following:
- Direct links to Station block PV, SP and MA blocks in more instances
- Handling duplicate column names in SPO tag database file
- Numerous places where appearance is improved in SPO graphics
- Elimination of many unnecessary live-value hotspots
Please continue to let us know when you see issues with your graphics, text, or hotspot placement. DBDOC's graphics support involves a fair amount of reverse engineering, and we are constantly learning more about the file formats we are supporting.
 |
| @Values like Set Point (SP) and Process Value (PV) on SPlus graphics were erroneously linking to the base Station Block, instead of the appropriate SP or PV blocks. This is corrected in 11.2 Feature Update. |
In another area, in response to client feedback, Hyperview has added full support for the "new" live specs on ladder diagrams (not just CAD/CLD diagrams). Prior to DBDOC 11.1, live specs were implemented as a form of live loop annotation, but this could be a highly inefficient use of live data bandwidth, as almost never changing specs were fetched as often as other sorts of live data. In DBDOC 11.1, specs were integrated with layered specs, and comparisons between live and static specs were automated (read more here). However, on our first pass, we missed adding this feature to ladder diagrams. This has now been corrected, and clients with ladder diagrams can now enjoy full-featured and bandwidth-efficient live specs.
 |
| Press S on Ladder Diagrams to show integrated live specs, automatically highlighting discrepancies between live and static values on wired inputs and other specs. |
Working CIUMON Interaction with ABB HAOPC
Several clients encountered a problem where CIUMON was found to be receiving data only once every 10 seconds from HAOPC. This has now was fixed and has been subsequently verified in three different client systems.
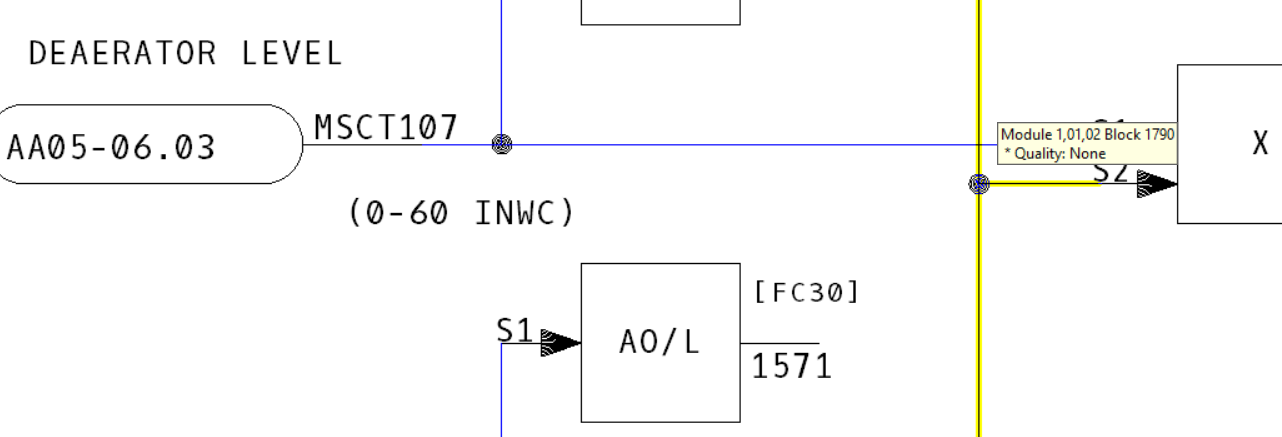
Documentation for Custom Function Codes
11.2 Feature Update generates automatic documentation of the inputs, outputs, and specifications of custom function code blocks.

In addition a variety of other minor fixes and additions are included in DBDOC 11.2 Feature Update. Please contact support @ gmcl.com if you have any questions about what has changed. It's entirely possible that issues you have seen in earlier versions are now fixed, and if not, we want to know!